Vue-ECharts
Vue.js (v2/v3) component for Apache ECharts™ (v5).
View Demo →


> [!IMPORTANT]
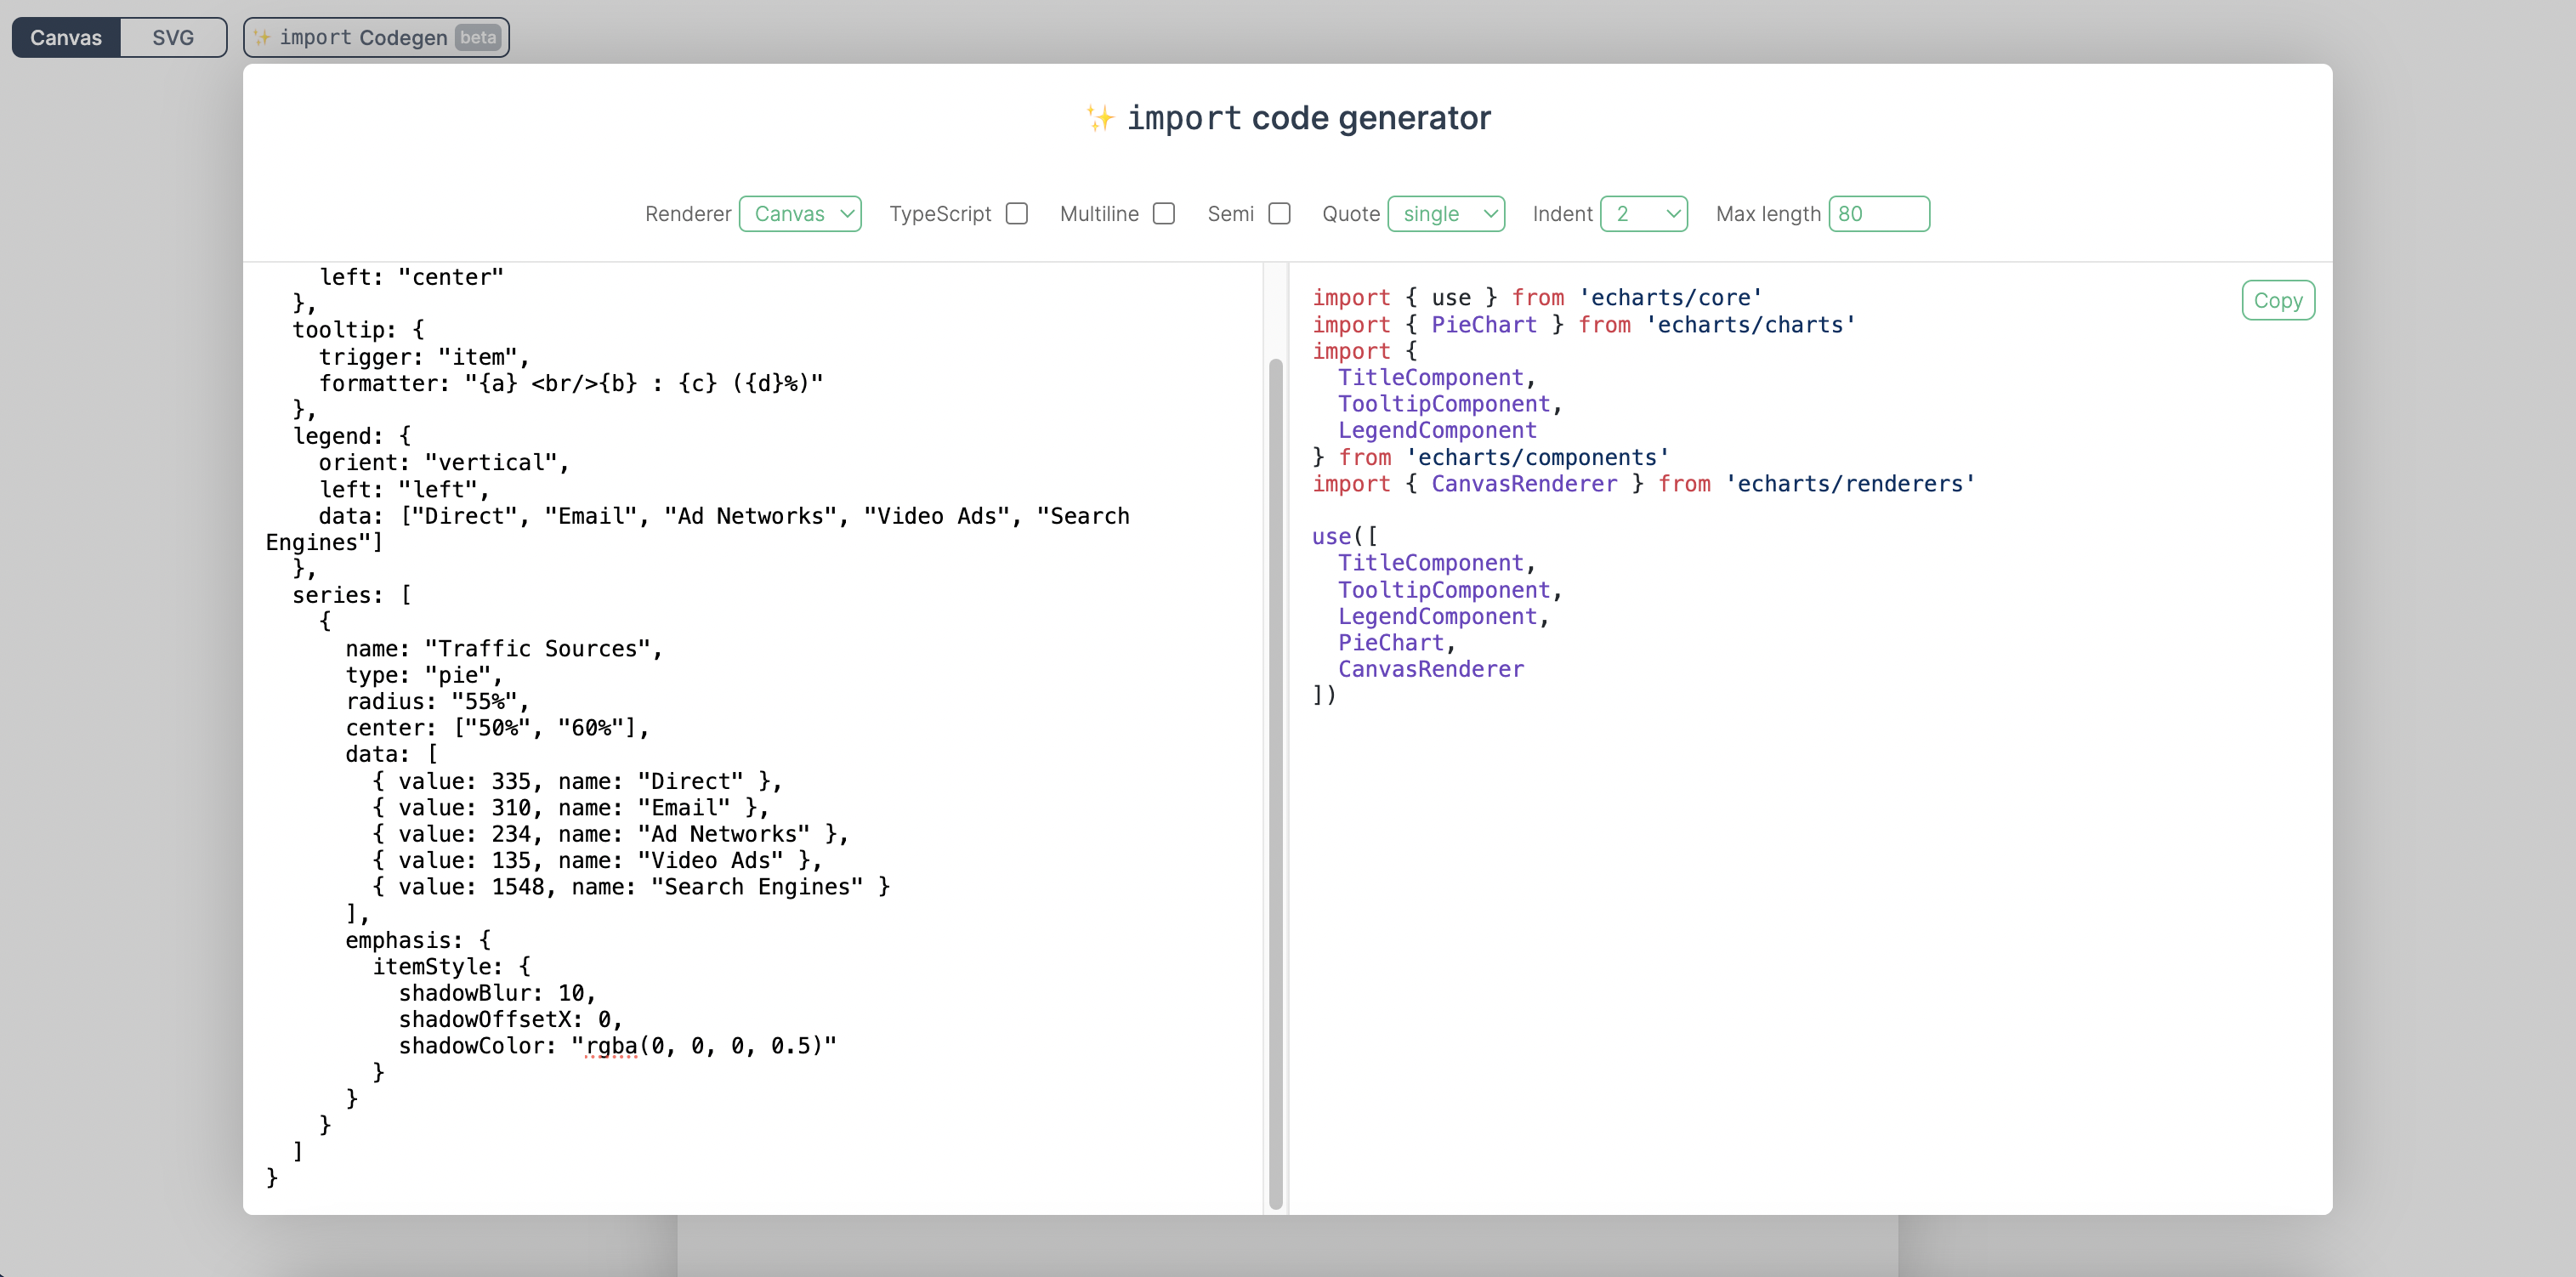
> We have released an [import code generator](https://vue-echarts.dev/#codegen) that can generate precise import code by pasting the `option` code.
>
> 
>
> [Try it →](https://vue-echarts.dev/#codegen)
---
💡 Heads up 💡 
If you are migrating from `vue-echarts` ≤ 5, you should read the _[Migration to v6](#migration-to-v6)_ section before you update to v6.
Not ready yet? Read documentation for older versions [here →](https://github.com/ecomfe/vue-echarts/tree/5.x)
## Installation & Usage
### npm & ESM
```sh
npm i echarts vue-echarts
```
To make `vue-echarts` work for _Vue 2_ (<2.7.0), you need to have `@vue/composition-api` installed (`@vue/runtime-core` for TypeScript support):
```sh
npm i @vue/composition-api
npm i @vue/runtime-core # for TypeScript support
```
If you are using _NuxtJS_ on top of _Vue 2_, you'll need `@nuxtjs/composition-api`:
```sh
npm i @nuxtjs/composition-api
```
And then add `'@nuxtjs/composition-api/module'` in the `buildModules` option in your `nuxt.config.js`.
#### Example
Vue 3 Demo →
```vue
```
Vue 2 Demo →
```vue
```
> [!IMPORTANT]
> We encourage manually importing components and charts from ECharts for smaller bundle size. We've built an [import code generator](https://vue-echarts.dev/#codegen) to help you with that. You can just paste in your `option` code and we'll generate the precise import code for you.
>
> [Try it →](https://vue-echarts.dev/#codegen)
But if you really want to import the whole ECharts bundle without having to import modules manually, just add this in your code:
```js
import "echarts";
```
### CDN & Global variable
Drop `
```
```js
const app = Vue.createApp(...)
// register globally (or you can do it locally)
app.component('v-chart', VueECharts)
```
Vue 2 Demo →
```html
```
```js
// register globally (or you can do it locally)
Vue.component("v-chart", VueECharts);
```
See more examples [here](https://github.com/ecomfe/vue-echarts/tree/main/src/demo).
### Props
- `init-options: object`
Optional chart init configurations. See `echarts.init`'s `opts` parameter [here →](https://echarts.apache.org/en/api.html#echarts.init)
Injection key: `INIT_OPTIONS_KEY`.
- `theme: string | object`
Theme to be applied. See `echarts.init`'s `theme` parameter [here →](https://echarts.apache.org/en/api.html#echarts.init)
Injection key: `THEME_KEY`.
- `option: object`
ECharts' universal interface. Modifying this prop will trigger ECharts' `setOption` method. Read more [here →](https://echarts.apache.org/en/option.html)
> 💡 When `update-options` is not specified, `notMerge: false` will be specified by default when the `setOption` method is called if the `option` object is modified directly and the reference remains unchanged; otherwise, if a new reference is bound to `option`, ` notMerge: true` will be specified.
- `update-options: object`
Options for updating chart option. See `echartsInstance.setOption`'s `opts` parameter [here →](https://echarts.apache.org/en/api.html#echartsInstance.setOption)
Injection key: `UPDATE_OPTIONS_KEY`.
- `group: string`
Group name to be used in chart [connection](https://echarts.apache.org/en/api.html#echarts.connect). See `echartsInstance.group` [here →](https://echarts.apache.org/en/api.html#echartsInstance.group)
- `autoresize: boolean | { throttle?: number, onResize?: () => void }` (default: `false`)
Whether the chart should be resized automatically whenever its root is resized. Use the options object to specify a custom throttle delay (in milliseconds) and/or an extra resize callback function.
- `loading: boolean` (default: `false`)
Whether the chart is in loading state.
- `loading-options: object`
Configuration item of loading animation. See `echartsInstance.showLoading`'s `opts` parameter [here →](https://echarts.apache.org/en/api.html#echartsInstance.showLoading)
Injection key: `LOADING_OPTIONS_KEY`.
- `manual-update: boolean` (default: `false`)
For performance critical scenarios (having a large dataset) we'd better bypass Vue's reactivity system for `option` prop. By specifying `manual-update` prop with `true` and not providing `option` prop, the dataset won't be watched any more. After doing so, you need to retrieve the component instance with `ref` and manually call `setOption` method to update the chart.
### Events
You can bind events with Vue's `v-on` directive.
```vue
```
> **Note**
>
> Only the `.once` event modifier is supported as other modifiers are tightly coupled with the DOM event system.
Vue-ECharts support the following events:
- `highlight` [→](https://echarts.apache.org/en/api.html#events.highlight)
- `downplay` [→](https://echarts.apache.org/en/api.html#events.downplay)
- `selectchanged` [→](https://echarts.apache.org/en/api.html#events.selectchanged)
- `legendselectchanged` [→](https://echarts.apache.org/en/api.html#events.legendselectchanged)
- `legendselected` [→](https://echarts.apache.org/en/api.html#events.legendselected)
- `legendunselected` [→](https://echarts.apache.org/en/api.html#events.legendunselected)
- `legendselectall` [→](https://echarts.apache.org/en/api.html#events.legendselectall)
- `legendinverseselect` [→](https://echarts.apache.org/en/api.html#events.legendinverseselect)
- `legendscroll` [→](https://echarts.apache.org/en/api.html#events.legendscroll)
- `datazoom` [→](https://echarts.apache.org/en/api.html#events.datazoom)
- `datarangeselected` [→](https://echarts.apache.org/en/api.html#events.datarangeselected)
- `timelinechanged` [→](https://echarts.apache.org/en/api.html#events.timelinechanged)
- `timelineplaychanged` [→](https://echarts.apache.org/en/api.html#events.timelineplaychanged)
- `restore` [→](https://echarts.apache.org/en/api.html#events.restore)
- `dataviewchanged` [→](https://echarts.apache.org/en/api.html#events.dataviewchanged)
- `magictypechanged` [→](https://echarts.apache.org/en/api.html#events.magictypechanged)
- `geoselectchanged` [→](https://echarts.apache.org/en/api.html#events.geoselectchanged)
- `geoselected` [→](https://echarts.apache.org/en/api.html#events.geoselected)
- `geounselected` [→](https://echarts.apache.org/en/api.html#events.geounselected)
- `axisareaselected` [→](https://echarts.apache.org/en/api.html#events.axisareaselected)
- `brush` [→](https://echarts.apache.org/en/api.html#events.brush)
- `brushEnd` [→](https://echarts.apache.org/en/api.html#events.brushEnd)
- `brushselected` [→](https://echarts.apache.org/en/api.html#events.brushselected)
- `globalcursortaken` [→](https://echarts.apache.org/en/api.html#events.globalcursortaken)
- `rendered` [→](https://echarts.apache.org/en/api.html#events.rendered)
- `finished` [→](https://echarts.apache.org/en/api.html#events.finished)
- Mouse events
- `click` [→](https://echarts.apache.org/en/api.html#events.Mouse%20events.click)
- `dblclick` [→](https://echarts.apache.org/en/api.html#events.Mouse%20events.dblclick)
- `mouseover` [→](https://echarts.apache.org/en/api.html#events.Mouse%20events.mouseover)
- `mouseout` [→](https://echarts.apache.org/en/api.html#events.Mouse%20events.mouseout)
- `mousemove` [→](https://echarts.apache.org/en/api.html#events.Mouse%20events.mousemove)
- `mousedown` [→](https://echarts.apache.org/en/api.html#events.Mouse%20events.mousedown)
- `mouseup` [→](https://echarts.apache.org/en/api.html#events.Mouse%20events.mouseup)
- `globalout` [→](https://echarts.apache.org/en/api.html#events.Mouse%20events.globalout)
- `contextmenu` [→](https://echarts.apache.org/en/api.html#events.Mouse%20events.contextmenu)
- ZRender events
- `zr:click`
- `zr:mousedown`
- `zr:mouseup`
- `zr:mousewheel`
- `zr:dblclick`
- `zr:contextmenu`
See supported events [here →](https://echarts.apache.org/en/api.html#events)
#### Native DOM Events
As Vue-ECharts binds events to the ECharts instance by default, there is some caveat when using native DOM events. You need to prefix the event name with `native:` to bind native DOM events (or you can use the `.native` modifier in Vue 2, which is dropped in Vue 3).
```vue
```
### Provide / Inject
Vue-ECharts provides provide/inject API for `theme`, `init-options`, `update-options` and `loading-options` to help configuring contextual options. eg. for `init-options` you can use the provide API like this:
Vue 3
```js
import { THEME_KEY } from 'vue-echarts'
import { provide } from 'vue'
// composition API
provide(THEME_KEY, 'dark')
// options API
{
provide: {
[THEME_KEY]: 'dark'
}
}
```
Vue 2
```js
import { THEME_KEY } from 'vue-echarts'
// in component options
{
provide: {
[THEME_KEY]: 'dark'
}
}
```
> **Note**
>
> You need to provide an object for Vue 2 if you want to change it dynamically.
>
> ```js
> // in component options
> {
> data () {
> return {
> theme: { value: 'dark' }
> }
> },
> provide () {
> return {
> [THEME_KEY]: this.theme
> }
> }
> }
> ```
### Methods
- `setOption` [→](https://echarts.apache.org/en/api.html#echartsInstance.setOption)
- `getWidth` [→](https://echarts.apache.org/en/api.html#echartsInstance.getWidth)
- `getHeight` [→](https://echarts.apache.org/en/api.html#echartsInstance.getHeight)
- `getDom` [→](https://echarts.apache.org/en/api.html#echartsInstance.getDom)
- `getOption` [→](https://echarts.apache.org/en/api.html#echartsInstance.getOption)
- `resize` [→](https://echarts.apache.org/en/api.html#echartsInstance.resize)
- `dispatchAction` [→](https://echarts.apache.org/en/api.html#echartsInstance.dispatchAction)
- `convertToPixel` [→](https://echarts.apache.org/en/api.html#echartsInstance.convertToPixel)
- `convertFromPixel` [→](https://echarts.apache.org/en/api.html#echartsInstance.convertFromPixel)
- `containPixel` [→](https://echarts.apache.org/en/api.html#echartsInstance.containPixel)
- `showLoading` [→](https://echarts.apache.org/en/api.html#echartsInstance.showLoading)
- `hideLoading` [→](https://echarts.apache.org/en/api.html#echartsInstance.hideLoading)
- `getDataURL` [→](https://echarts.apache.org/en/api.html#echartsInstance.getDataURL)
- `getConnectedDataURL` [→](https://echarts.apache.org/en/api.html#echartsInstance.getConnectedDataURL)
- `clear` [→](https://echarts.apache.org/en/api.html#echartsInstance.clear)
- `dispose` [→](https://echarts.apache.org/en/api.html#echartsInstance.dispose)
### Static Methods
Static methods can be accessed from [`echarts` itself](https://echarts.apache.org/en/api.html#echarts).
## CSP: `style-src` or `style-src-elem`
If you are applying a CSP to prevent inline `